

BetUS

BetNow

MyBookie

Bet105

BUSR Sports

Everygame Sports

BetOnline

BetWhale

BetAnything

Xbet

Bovada

Bookmaker
A betting line is a threshold, not a win rate.
A team listed at -6.5 can win by three points and still fail to cover the spread. For an outright-win model, that three-point win counts just as much as a blowout: the question is how often the final margin lands above zero, not above 6.5.
That conversion requires a margin distribution—an estimate of how far results tend to wander from the spread. The same -6.5 line can imply different win probabilities in sports with different scoring variability. The quoted spread provides a starting point, but it cannot supply a win probability on its own.
Set the team and spread sign
Before estimating a win probability, name the team whose chance is being modeled. Record every spread from that team’s perspective: −6.5 means the target team gives 6.5 points and is favored; its opponent is +6.5 and receives those points. If the target changes, reverse the sign. This convention matters when applying point spread basics to a model or joining lines to team-level results.
The desired output is the probability that the target wins outright, based on the unadjusted final score—not the probability that it covers. If a −6.5 target wins 24–20, its outright-win label is 1, but its cover label is 0: subtracting 6.5 leaves 17.5 against 20. Training on cover labels would answer a different question.
Top Sportsbook Picks for October 2026
BetUS
BetNow
MyBookie
Bet105
BUSR Sports
Everygame Sports
BetOnline
BetWhale
BetAnything
Xbet
Bovada
Bookmaker
As a data check, store the target team’s name alongside its signed spread and outright result. A negative spread should always indicate that the named team is favored, even when a source lists the line from its opponent’s perspective.
Estimate how much margins vary
A spread gives a line-implied margin, not the chance of winning. A six-point favorite might win by one point or by twenty; the probability of an outright win depends on how widely actual margins vary around the line.
A normal distribution is a workable starting approximation. Let M be the target team’s final score minus its opponent’s, and s its signed spread. The line-implied margin is −s, so model M as normally distributed with mean −s and standard deviation σ. The implied win probability is then P(M > 0) ≈ Φ(−s / σ), where Φ is the standard normal cumulative distribution function.
Estimate σ from past games in the same sport or league. For each game, subtract the line-implied margin from the actual margin: residual = M − (−s) = M + s. The sample standard deviation of those residuals estimates how much results typically depart from the spread. For example, a target team at −6 with σ = 12 has an approximate win probability of Φ(0.5), or 69%. That figure is only as reliable as the residual estimate and the normal approximation.
Raw scores and unadjusted winning margins mix game-to-game strength differences with outcome variability. They do not estimate the σ this calculation needs.
Turn the spread into an expected margin
Define margin as the target team’s score minus its opponent’s score. Then reverse the sign of the target team’s handicap: expected margin = − signed spread. A team listed at −6.5 has an expected margin of +6.5 points; a team listed at +6.5 has an expected margin of −6.5 points.
This step assumes the margin distribution is centered on the market line. It is a practical starting point, not proof that the team’s true average winning margin equals the spread. If a separate model supplies a credible expected margin, that estimate can replace the line-based one.
The win-probability calculation now has two inputs, both measured in points from the target team’s perspective: expected margin and margin standard deviation. The first locates the center of the distribution; the second describes how widely game outcomes vary around it.
Calculate the outright-win probability
With an expected margin and a margin standard deviation, the normal model gives:
P(target team wins) = Φ(expected margin ÷ margin standard deviation)
Here, Φ is the standard normal cumulative distribution function: it returns the area under the normal curve to the left of a given value. If the target team is favored by 3.5 points, its expected margin is +3.5. With a margin standard deviation of 10, Φ(3.5 ÷ 10) gives an estimated win probability of about 63.7%.
In a spreadsheet, put expected margin in C2 and margin standard deviation in D2, then enter =NORM.S.DIST(C2/D2,TRUE). The equivalent Python calculation is scipy.stats.norm.cdf(expected_margin / margin_sd).
The cutoff is zero because an outright win means the target team scores more points than its opponent. Covering a −3.5 spread instead requires a margin greater than 3.5. A two-point win counts as a win, but not a cover. This continuous normal calculation also treats an exact tie as having zero probability.
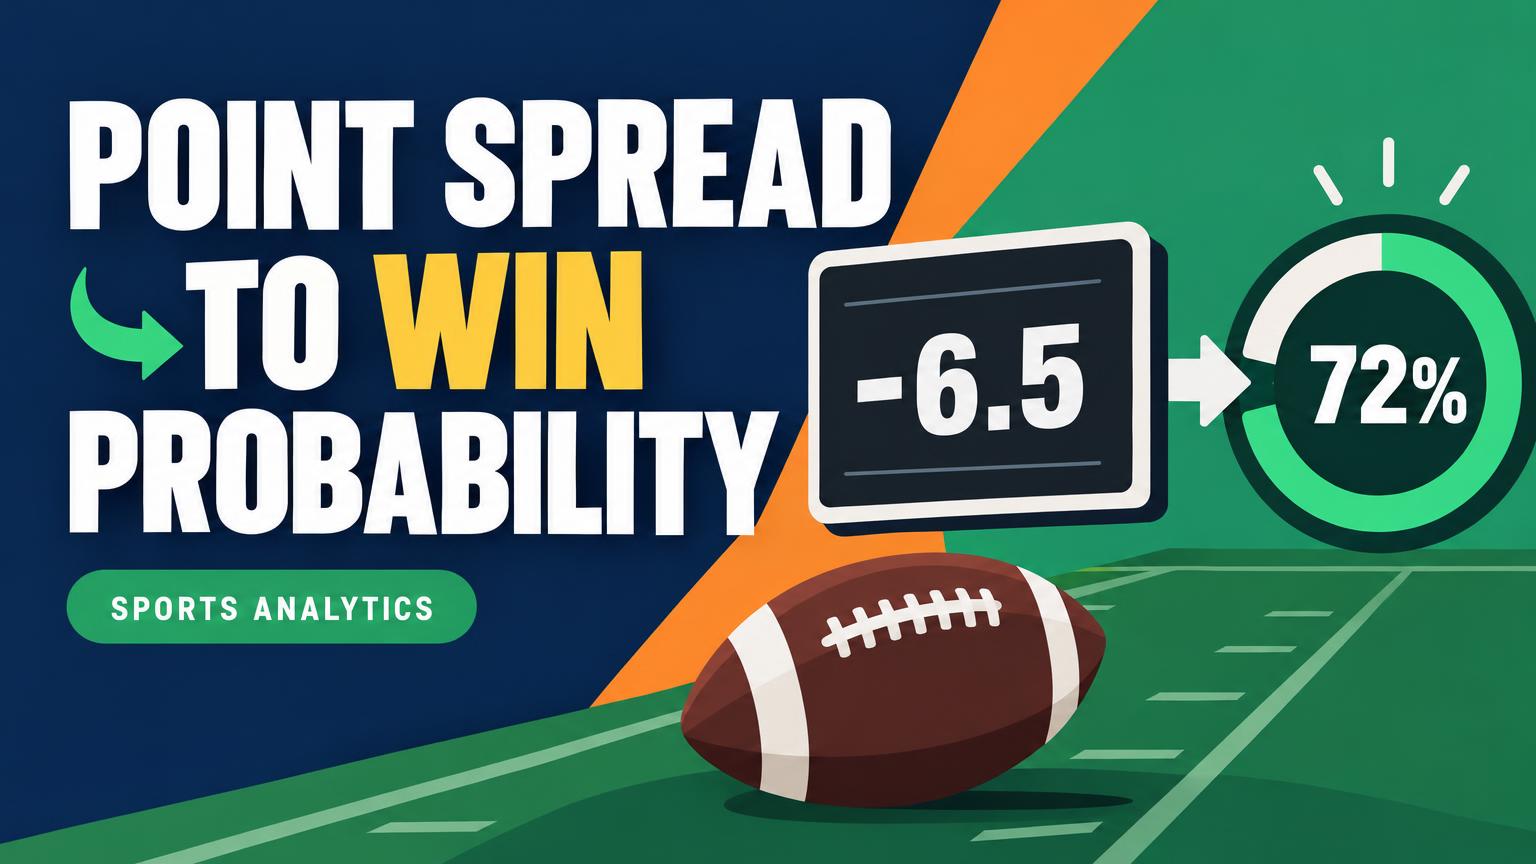
Work through a −6.5 favorite
Suppose the target team is favored by 6.5 points, so its spread is −6.5. Negating that spread gives a line-implied expected margin of +6.5 points: the model centers the target team’s score 6.5 points above its opponent’s.
For this example, assume a 13-point standard deviation for the margin. That number is hypothetical, not a default for any sport or league; a working model should use a variability estimate suited to its own games and data.
The favorite wins outright when its margin exceeds zero. With an expected margin of +6.5 and a standard deviation of 13, zero is half a standard deviation below the mean:
(0 − 6.5) / 13 = −0.5
A standard normal table or CDF gives P(margin ≤ 0) = Φ(−0.5) ≈ 0.3085. Taking the complement gives the favorite’s implied outright-win probability: 1 − 0.3085 ≈ 69.1%. The opponent’s probability is about 30.9%.
These two probabilities add to 100% because this calculation treats the margin as continuous and assigns zero probability to an exact tie. They describe winning the game, not the favorite’s chance of covering −6.5.
What a spread does not tell the model
It suggests a margin, but not how widely actual margins vary.
The 69.1% example depends on its assumed 13-point standard deviation. A different estimate produces a different probability.
Spread-bet odds price the chance of covering the handicap, not merely winning.
A favorite can win by fewer points than the spread. Bookmaker margin also affects the quoted price.
Actual margins are discrete; ties may be possible, and some margins occur unusually often.
In NFL data, margins of three and seven are prominent. When those patterns matter, an empirical margin distribution can estimate wins, losses and ties separately.
Check probabilities against past results
Keep a dated record of each spread and the probability calculated before the game, then attach the final winner afterward. Test on a later, held-out period: estimating margin variability and judging forecasts on the same games can make the fit look better than it is. Do not replace an archived spread with a closing number unless the model actually used that number.
Compare forecasts with outcomes
Group predictions into ranges such as 50–59%, 60–69%, and 70–79%. Within each range, compare the average predicted probability with the share of target teams that won. For example, if 200 games average a 65% forecast but only 110 target teams win, the observed rate is 55%: that range looks too confident. Record the game count too, since a gap in a small bucket may be noise.
If the mismatch persists across seasons or several well-populated buckets, revisit the assumed margin standard deviation or fit a direct spread-to-win mapping from historical games. Check any revision on a fresh period. Closing-line value alongside implied probabilities can indicate whether forecasts beat later market prices, but it cannot establish whether 65% forecasts win about 65% of the time.
Make the conversion reproducible
- Fix the target and sign
Record which team’s outright win is being modeled and its signed spread.
- Save the margin model
Store the distribution, the line-based expected margin, and the estimated margin standard deviation with the output.
- Calculate and label the probability
Apply the model’s margin-to-win calculation. Label the result as an outright-win estimate, not a cover probability.
- Keep the estimate traceable
Record the data period used to estimate variability and the model version so later results can be compared on the same basis.
The resulting number is a model input under stated assumptions, not a win probability hidden inside the spread. Keeping the distribution and estimated parameters beside each output makes changes in the calculation visible.
Top Sportsbook Picks for October 2026
BetUS
BetNow
MyBookie
Bet105
BUSR Sports
Everygame Sports
BetOnline
BetWhale
BetAnything
Xbet
Bovada